
Location:
FIR Field Sound Reinforcement Application Series An Example of Optimizing Speaker Phase Using FIR Pr
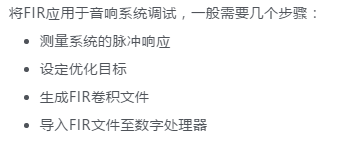
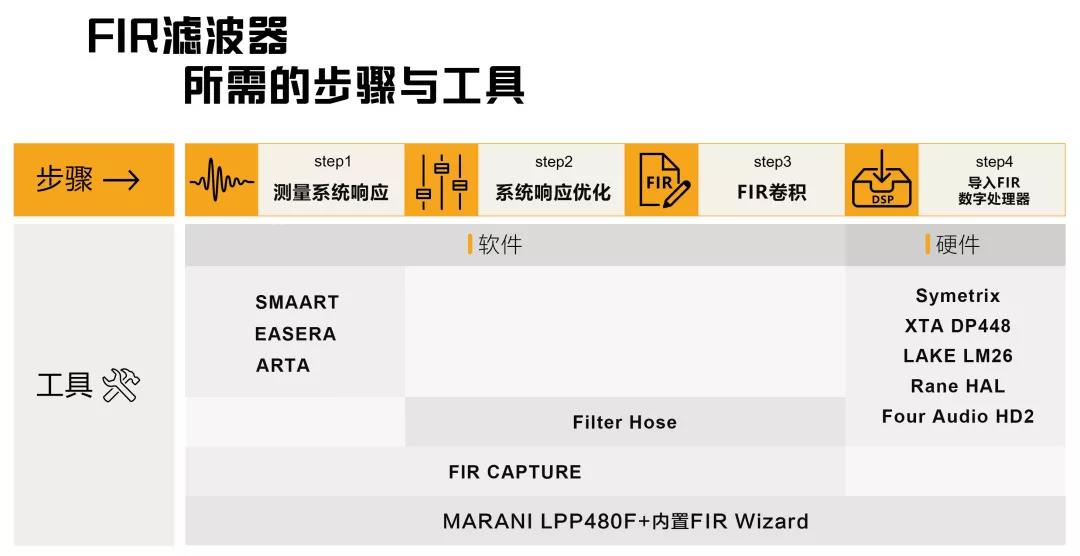
Application steps of FIR filter
Audio engineers must collect more hardware and software equipment in order to complete the optimization process. The cost of this whole set of hardware and software may be as high as tens of thousands of yuan all the time. To master the operation of these hardware and software skillfully also requires a high cost of learning time. This makes many people afraid of FIR processing technology.

Marani LPP480F處理器
Marani LPP480F, a linear phase processor, is a rare FIR processing scheme which integrates hardware and software in the market. It greatly reduces the application threshold of FIR technology in terms of economic cost and learning cost. The built-in FIR wizard (FIR wizard) module of PC software matched with its processor integrates the steps of impulse response measurement, optimization goal setting and FIR convolution generation into a software module, and helps users complete the whole FIR optimization process bystep by step guidance. We will use LPP480F to optimize the phase of speakers with different frequency division structures.
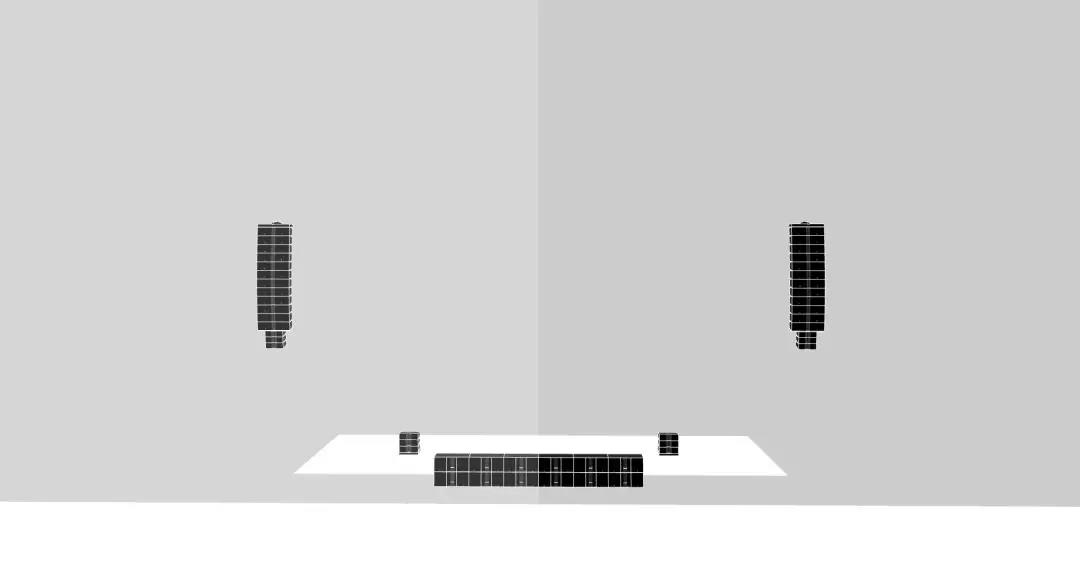
Schematic diagram of typical large-scale sound reinforcement system
For systems using analog passive frequency division or digital IIR frequency division, the phase offset of the frequency divider roughly determines the phase response curve of the speaker. The following figure shows the amplitude response and phase response of full-frequency speakers with three, two and one frequency dividers.
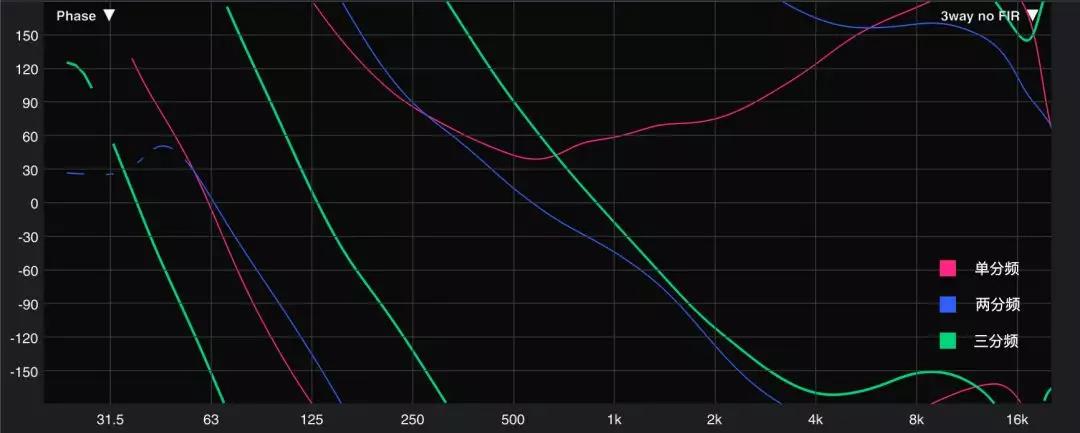 Phase Response Curves of Three Speakers with Different Frequency Division Structures
Engineers who have done system debugging should have a deep understanding. It is not a simple matter to couple the speakers with different frequency dividing structures. It often requires the combination of polarity, delay, frequency dividing settings and all-pass filters to achieve phase coupling in part of the frequency band. For engineers who are not solid in theory or lack of practical experience, it is difficult to apply these methods skillfully. Moreover, the measurement environment of the performance site is relatively complex, and the time for engineers to debug the system is also very tense, which makes the phase coupling between speakers with different frequency division structures very difficult.
FIR linear phase processor gives acousticians the possibility of realizing speaker phase optimization, and the technological process is simpler than that of IIR processor.
The clear concept is that the phase optimization demonstrated in this paper is to optimize the initial phase of the speaker. Specifically, it refers to the phase response of a single speaker in close range testing.
Because of the limitation of time delay and frequency accuracy in FIR processing, frequency division using FIR as speaker unit is not the first choice. Better way is to use IIR filter to set up the frequency division of the speaker, and then use FIR filter to optimize the phase curve of the speaker, so that all the phase curves above the effective working frequency of FIR become straight.
We connect three groups of speakers with different frequency division structures to three independent channels of LPP480F, so each channel can do independent FIR digital processing. The connection diagram of the test system is as follows:
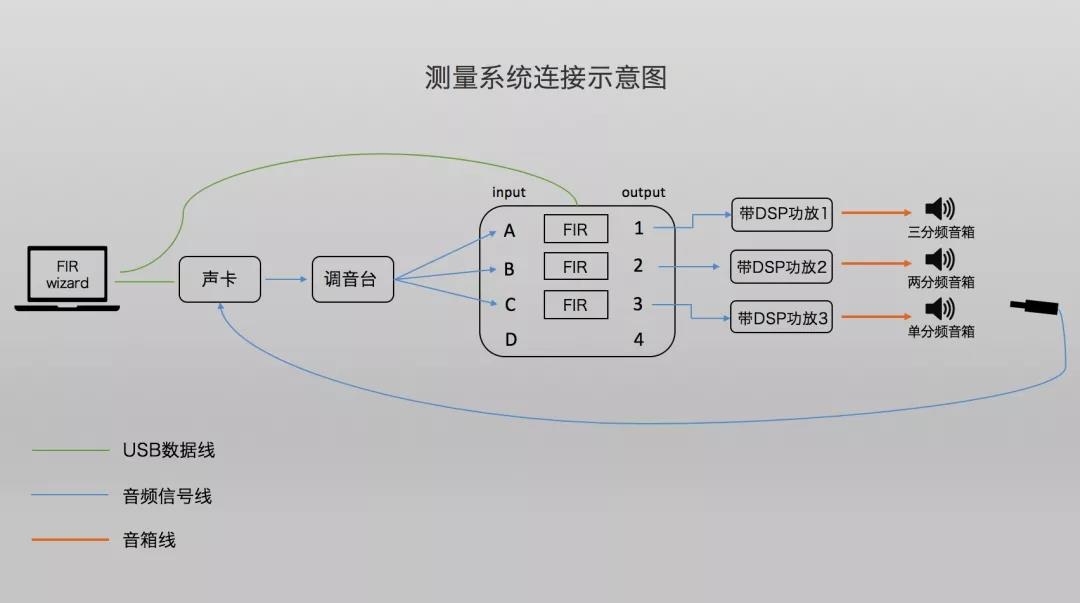 Connection diagram of measuring system
We start with the optimization of the three-frequency speaker, open the FIR Wizard (FIR wizard) of the first channel, and connect the sound card and the test microphone according to the prompt. Before that, the speaker has done the basic frequency division, balancing adjustment and the phase coupling between the frequency bands. We are in the speaker factory preset on the basis of phase optimization! In order to measure the results as accurately as possible, it is of course best to measure in the anechoic chamber environment, of course, this condition is not available for most application engineers. In the absence of anechoic chamber, there are two practical choices: one is to place the test microphone with near-field measurement, the microphone and the tested microphone are as far away from the ground, ceiling and wall as possible, such as in the open space, the speaker and the test microphone are as high as possible; the other is to use interface method to place the test microphone and the test microphone on the ground with strong reflection. At the same time, speakers and microphones are as far away from other reflective surfaces (such as walls) as possible. Through these two methods, the proportion of direct sound picked up by the test microphone is higher, while the reflection sound is lower, which means that the measurement signal-to-noise ratio is higher.
In addition, it should be noted that the "near-field test" here does not advocate that the closer the microphone is to the speaker, the better, nor is it necessarily the distance of 1 m required for some parameters measurement. In practice, the test microphone is recommended to be placed on the axis about three times the maximum size of the speaker. If it is affected by the reflection interface, the microphone can be appropriately swing.

LPP480 FIR-wizard 脈沖響應測量界面
Firstly, the impulse response of the three-frequency speaker is measured. After obtaining the impulse response, the length of the time window is selected, and the setting of the length of the time window will also affect the lower frequency limit of FIR processing. We set it to 5ms, and then set the object of optimization. Because we only do phase optimization, check Phase Only here, select the optimization frequency of 250Hz - 20000Hz, click Calculate FIR, generate FIR convolution file, and save FIR file to the processor.
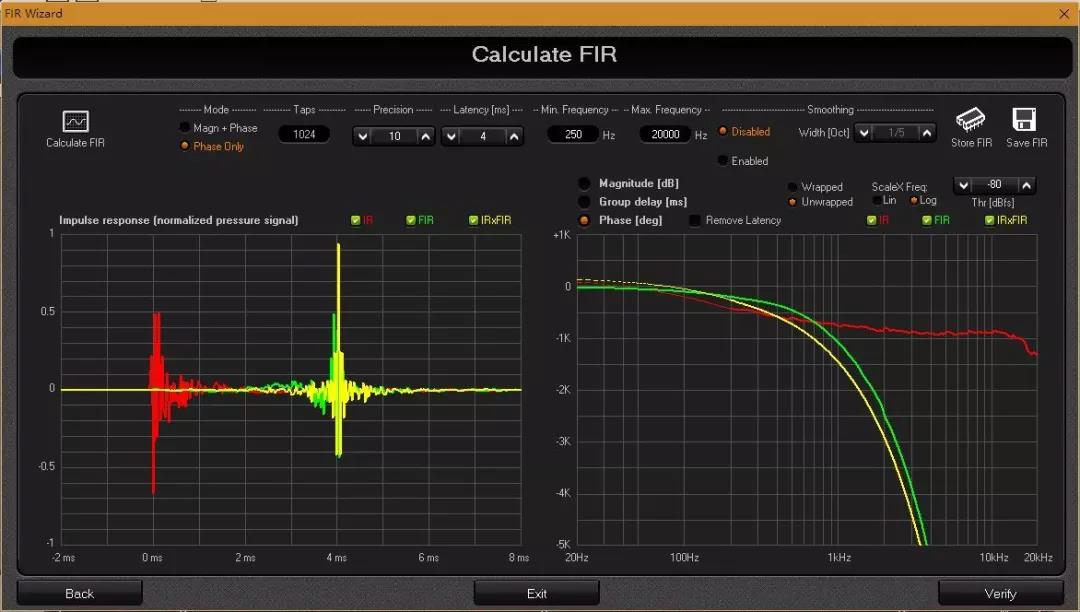 LPP480 FIR-wizard FIR卷積生成界面
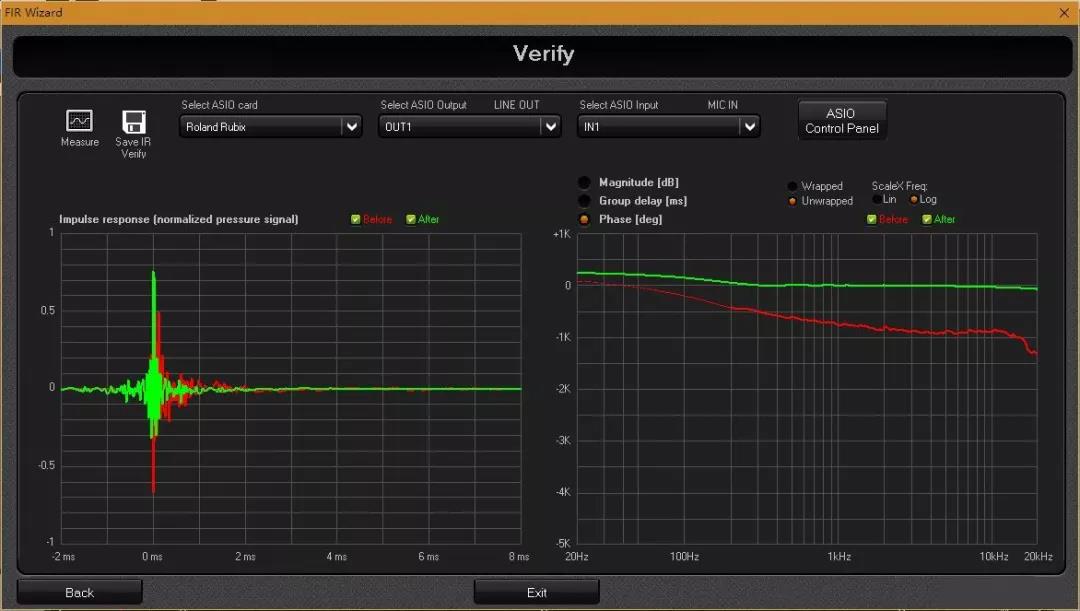
Amplitude response and phase response after phase optimization
Because there are some differences between the X/Y axis scale of FIR Wizard curve and Smart software, we use Smaart software to measure and verify again, and make comparison before and after optimization, which is convenient for observation.

Frequency response comparison of three-frequency speaker before and after FIR optimization
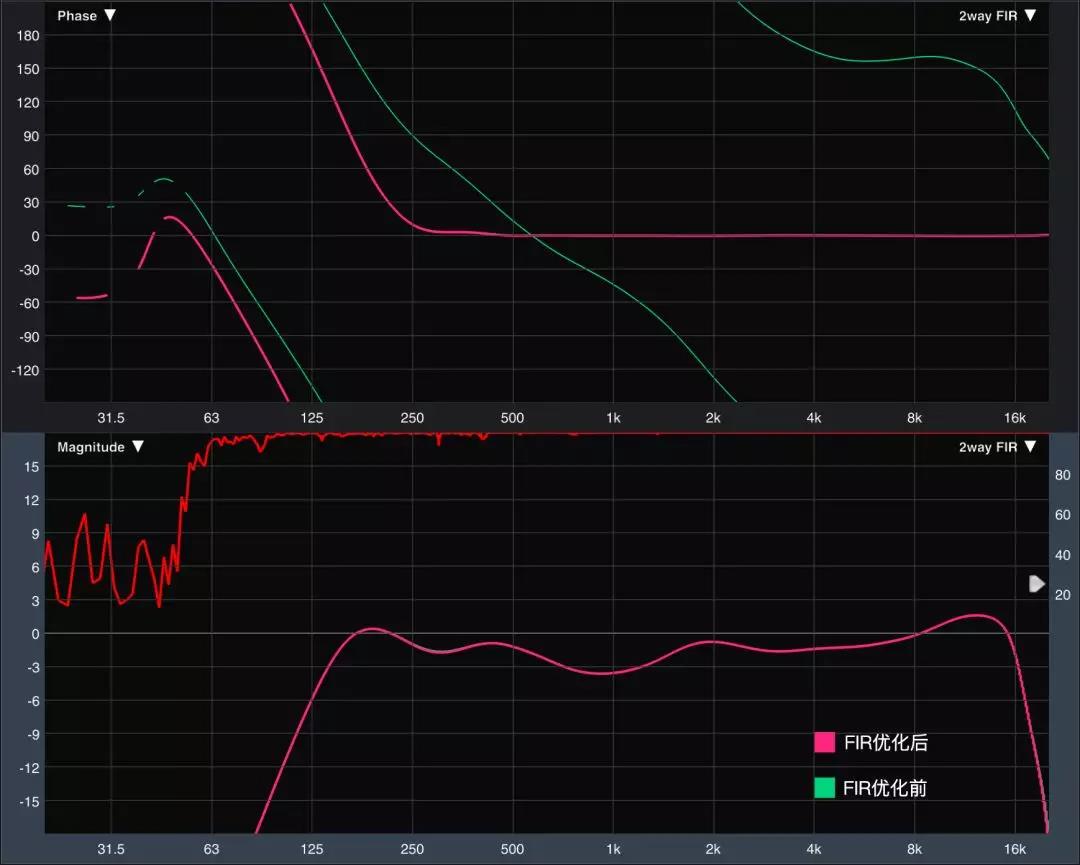
Frequency comparison before and after FIR optimization of two-frequency speaker
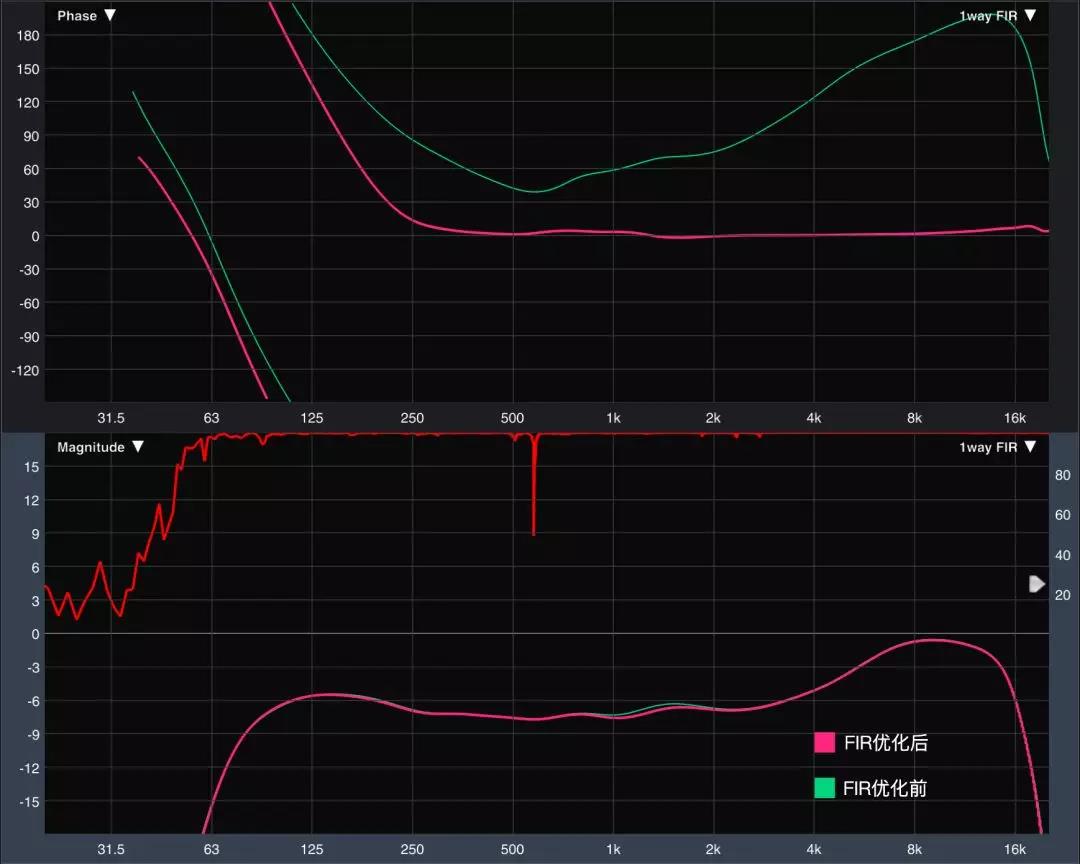
Frequency comparison before and after FIR optimization for single-frequency speaker
Following the same steps and methods, we optimized the phase of three-frequency, two-frequency and single-frequency speakers. The optimized frequency response charts of the three speakers are as follows:
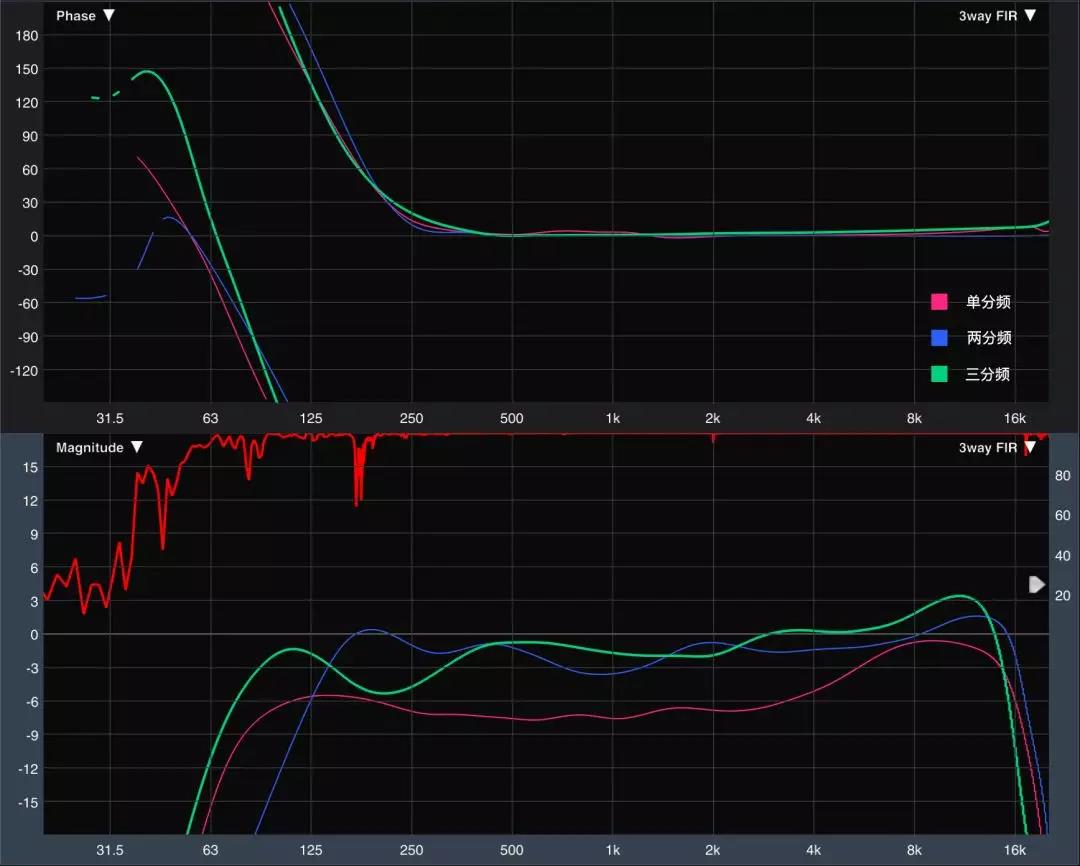
Comparison of Frequency Response of Three Soundboxes before and after FIR Optimization
It can be seen that above the FIR set processing frequency, i.e. 250Hz-20000Hz, the phase of the three speakers is almost a straight line near 0 degrees. In the frequency band below 250Hz, the phase response is slightly different. After adjusting the parameters of the frequency divider filter (filter type and slope), the phase of the three speakers at low frequency is as close as possible. After optimization, the phase response of the three speakers with different frequency division structures is almost the same in the whole frequency band, and the difference is within 30 degrees. Since we did not optimize the amplitude response, there was no change in the amplitude response before and after optimization.
For the time delay of FIR processing, the sampling rate of LPP480F is 96 kHz and the Taps of FIR is 1024.
L = N/fs/2 = 10.66/2 = 5.33 ms, and the measured delay is about 5.4 ms, which is acceptable for the main sound reinforcement system.
After initial phase optimization, several speakers have the same phase response. When these speakers are used in the same large-scale sound reinforcement system at the same time, the phase coupling of the whole frequency band can be realized quickly only by means of alignment delay. This will undoubtedly provide great convenience for the debugging of sound reinforcement system.